Advanced Study
Surface area extremes for fixed volume
Prime Shapes explore a classic geometric question: for a fixed volume n, which 6-sided shape (rectangular prism) has the smallest surface area, and which has the largest? We use unit cubes with integer dimensions w, h, l where w · h · l = n.
Surface area formula
What we minimize or maximize
For any rectangular prism, surface area is:
SA(w,h,l) = 2 ( w·h + w·l + h·l )
All shapes here are 6-faced prisms built from unit cubes.
Maximum surface area
Most inefficient shape
Stretch the prism into a tower.
- Shape: 1 × 1 × n
- Surface area: SAmax(n) = 4n + 2
- Examples: n=1 ⇒ SA=6; n=10 ⇒ SA=42
- Why primes spike: primes are forced into this tower form.
Absolute minimum (ideal)
If dimensions are real numbers
- Shape: ideal cube with w = h = l = n^(1/3)
- Surface area lower bound: SAabs min(n) = 6 · n^(2/3)
- Note: This is the true minimum, but it may not be reachable with integer edges.
Integer minimum
Prime shape for n
When edges must be integers, choose the factor triple with the smallest surface area. That's usually the one closest to a cube — but not always. The first exception is n = 360: the cube-like 5×8×9 (SA 314) loses to 6×6×10 (SA 312). We call these deceptive numbers; there are 65 of them below 50,000.
SAmin(n) = minw,h,l ∈ Z+; w·h·l = n 2 ( w·h + w·l + h·l )
Special case: if n = k³, the cube is achievable and SAmin(k³) = 6k².
Otherwise SAmin(n) > 6 · n^(2/3); the gap comes from the factor structure of n.
Why this matters
- Primes: forced into 1×1×n towers → maximum surface area.
- Perfect cubes: exact cubes → minimum surface area.
- Composites: land between these extremes; efficiency tracks cube-likeness.
- Takeaway: surface area becomes a geometric measure of factor efficiency.
Summary
Three lenses, one shape
Three equivalent ways to find the prime shape.
1 · Geometry
Minimize surface area:
SA = 2(wh + wl + hl)
The original definition.
2 · Arithmetic
Minimize the reciprocal sum — an exact identity:
SA = 2n(1/w + 1/h + 1/l)
Small edges are expensive; an edge of 1 costs a full unit. This is why towers are worst.
3 · Metric (conjecture)
Minimize log-distance from the ideal cube:
Σ (ln d − ln ∛n)²
Matches lens 1 for every n ≤ 50,000. The linear version fails (first at n = 92) — dimensions live in multiplicative space.
Elemental shapes
What if the primes refuse to mix?
Keep each prime's full power together as one edge and you get the number's elemental shape: 720 = 2⁴·3²·5 → 16×9×5. Comparing it to the true prime shape measures how much a number saves by letting its primes mix — its fusion energy.
A parallel taxonomy
Prime shapes classify numbers by prime factors with multiplicity (Ω); elemental shapes classify by distinct primes (ω). One distinct prime → elemental tower. Four distinct primes → the elemental shape doesn't fit in 3D at all. The first such number: 210.
Unmixed numbers
For about 65% of numbers, elemental and prime shape agree — the primes don't want to mix (6, 30, 60, 84, 105…). Prime powers pay the most for purity: 3⁹ = 19,683 is elementally a 1×1×19683 tower (SA 78,734) but folds into a 27×27×27 cube (SA 4,374).
It explains 360
360's deceptive runner-up 5×8×9 is its elemental shape (5·2³·3²). The famous near-miss is elemental purity losing to fusion by the smallest possible margin: 2 units of surface area.
Prime vs elemental vs ideal cube
Three shapes for every number, one chart.
Every number lives between two walls: the tower ceiling (4n + 2, where the primes are trapped) and the ideal-cube floor (6·n²ᐟ³, reachable only by perfect cubes). The green line is the prime shape; the blue dots show what the same number costs if its primes refuse to mix. Red dots are numbers with four or more distinct primes, built by nesting: three primes become the dimensions, and each remaining prime's shape is plugged into every block — a fourth dimension folded inside the third.
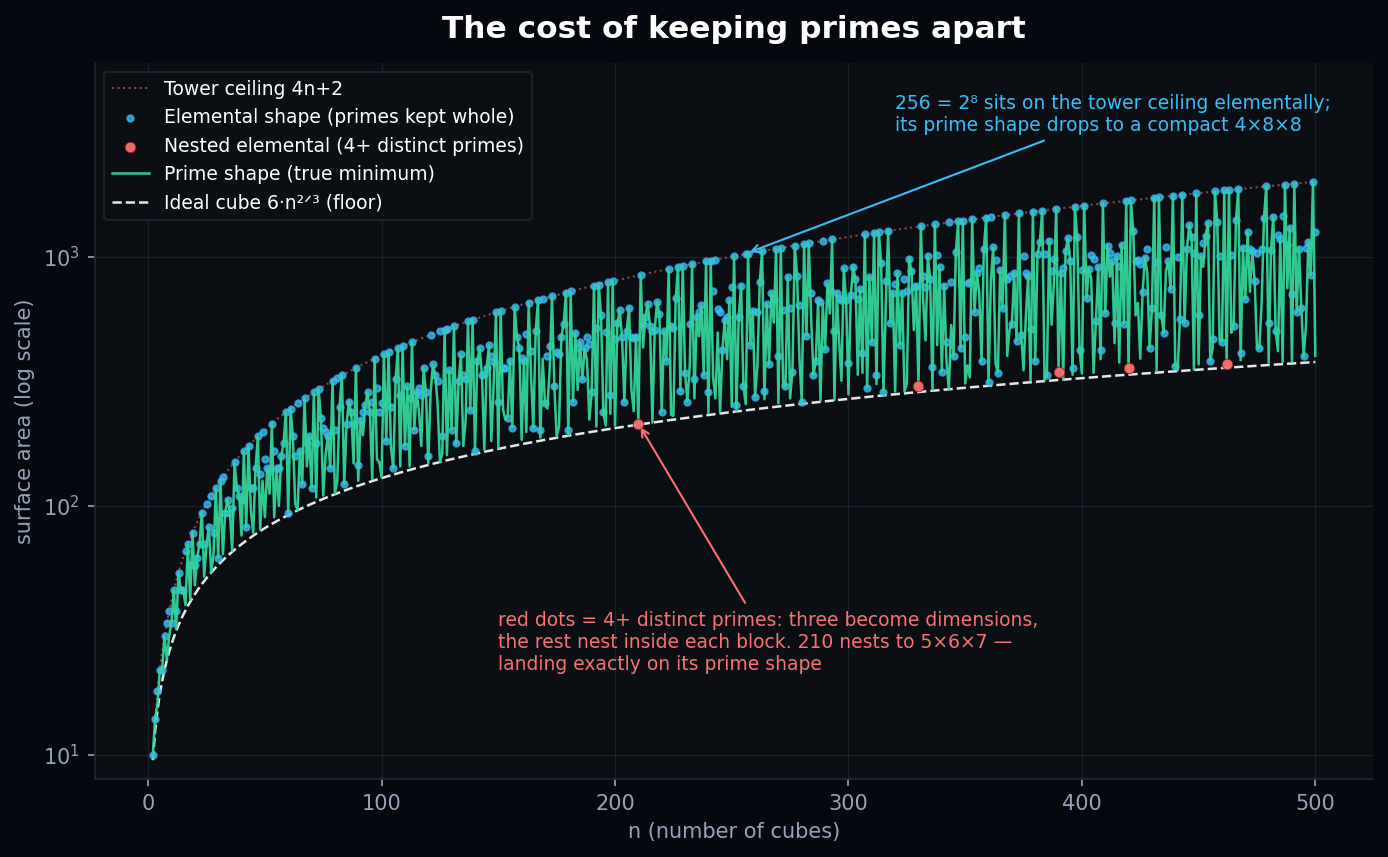
The green oscillation
The prime shape bounces between the walls: primes touch the ceiling, factor-rich neighbors dive toward the floor. One added cube can collapse the surface.
Blue dots on the ceiling
Prime powers (2⁸, 3⁵…) sit on the tower ceiling elementally — keeping their primes together costs them everything.
Red dots: nested shapes
Four distinct primes don't fit in three dimensions — so the extras nest: 210 = 3×5×7 where every block is itself a 2-tower, fusing into 5×6×7. Nesting lands exactly on the true prime shape for 73% of these numbers — including 210 and 2310 (11×14×15).
The taxonomy, measured
The shape family tree becomes visible.
Divide every number's surface area by its ideal-cube bound and the five shape classes separate into bands — towers arcing away on top, plates below them, pure bricks below those, and fused bricks hugging the floor with the perfect cubes.
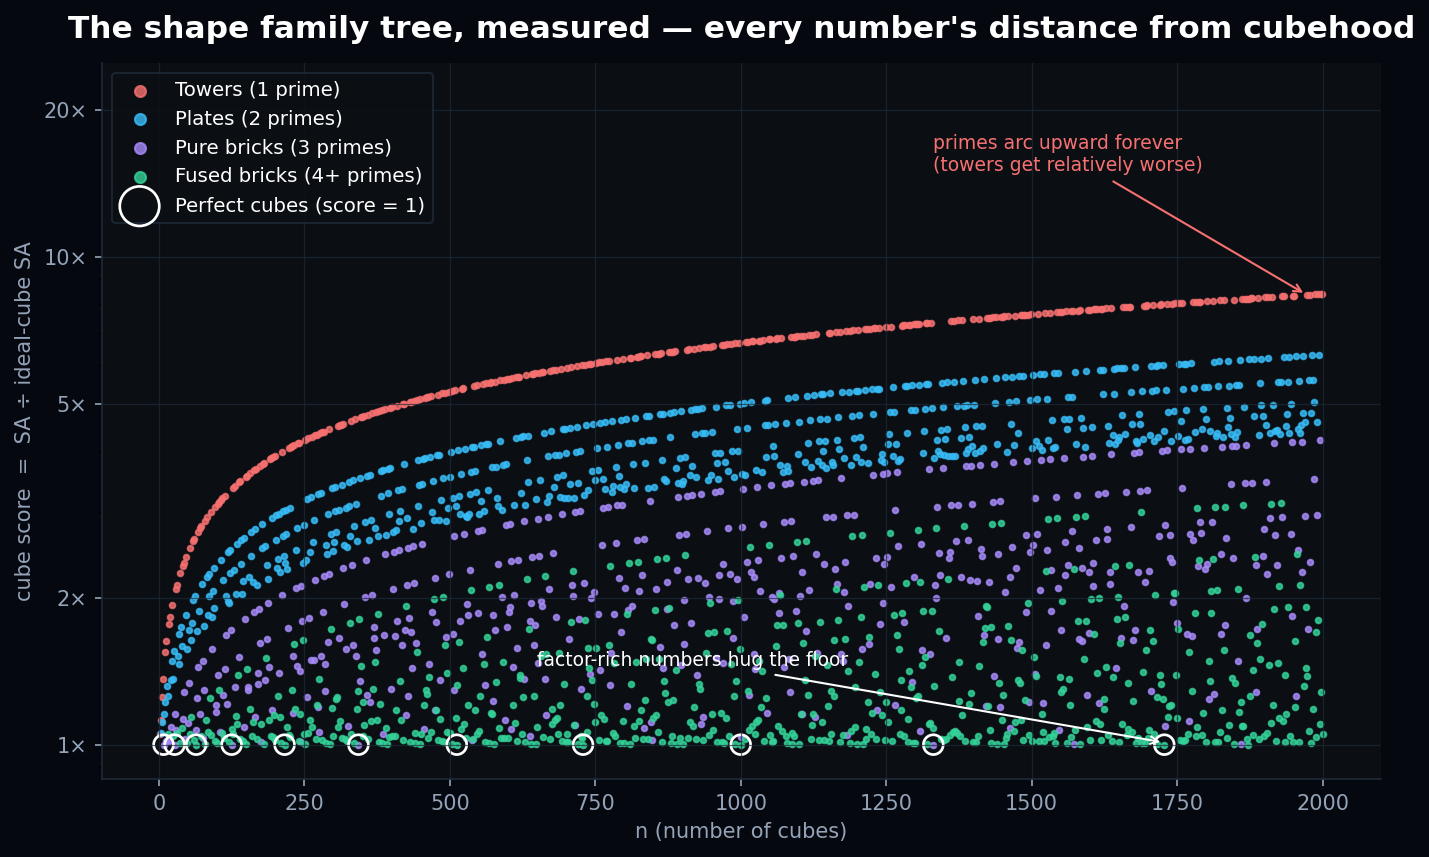
Each band is a theorem you can see: the number of prime factors sets the silhouette, and the silhouette sets the efficiency. The fine sub-stripes inside each band are families too — can you identify one?
Fusion energy
What mixing is worth, number by number.
Fusion energy = the percent of surface a number sheds when its primes are allowed to mix instead of staying elemental. Green dots on the zero line are the unmixed numbers — already optimal. The spikes are numbers desperate to fuse.
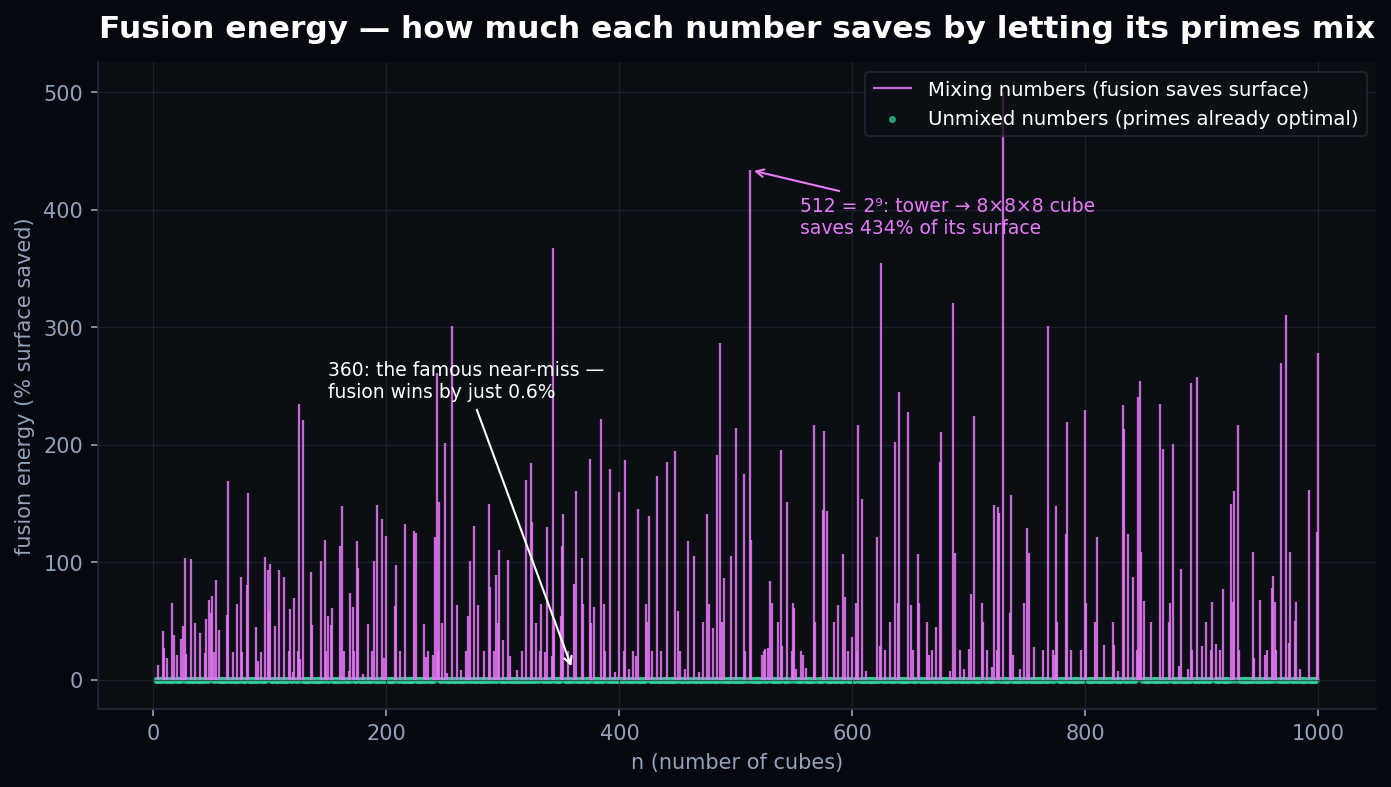
The tallest spikes are prime powers — 512 = 2⁹ sheds 434% of its surface folding from a 1×1×512 tower into an 8×8×8 cube. And 360's spike is nearly invisible: its elemental shape loses by only 0.6%, the closest fight we've found.
Surface area vs volume (1–100)
How surface area scales with volume
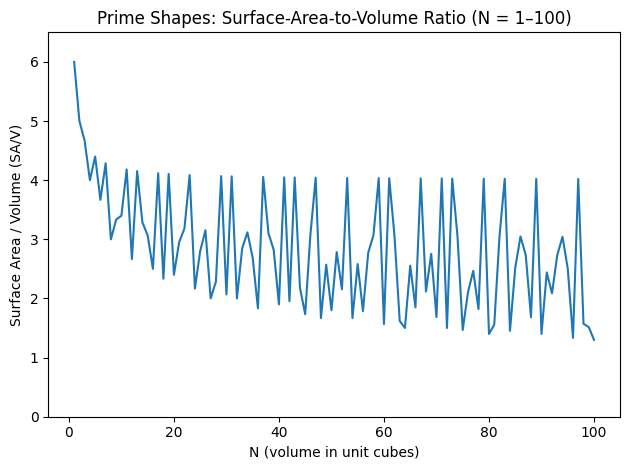
Balancing dimensions reduces exposed faces. This visual makes efficiency tangible—stretch a side and surface area jumps; balance sides and it shrinks.
How to read it
- • Lower is better → less surface area per unit of volume.
- • Perfect cubes (1, 8, 27, 64) form the deep troughs.
- • Primes spike upward because they’re forced into 1×1×n towers.
- • As N grows, the overall trend falls → shapes get more efficient.
Why this chart is useful
- • Explains why cubes are optimal.
- • Shows why primes are “inefficient” shapes.
- • Makes surface-area minimization obvious without formulas.
Next ideas: color-code primes vs composites, highlight perfect cubes, export to SVG/PNG for the homepage, or recreate this live with explorer data.
Long-range view
Surface-area-to-volume from 1 to 1000
Zooming out reveals the limits: cubes hug the lower envelope, primes spike to the top, and composites settle in between.
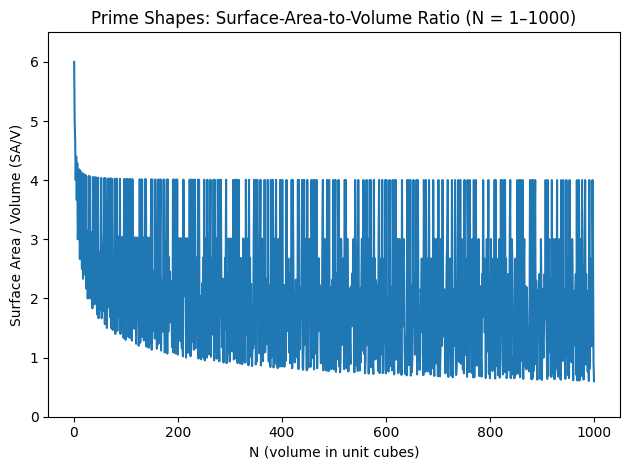
Max line (primes/towers)
1×1×n towers converge to SA/V ≈ 4 as n → ∞ (plus a shrinking 2/n term). Every prime sits on this line.
Min line (ideal cubes)
Cubes converge to SA/V ≈ 6 / n^(1/3). Perfect cubes (1, 8, 27, 64, 125, …) trace the trough.
Composites in between
Factor-rich numbers drop closer to cubes; “skinny” composites trend upward. The band narrows as n grows.
Takeaway: as n gets large, the maximum SA/V approaches 4 (towers), while the minimum achievable approaches 0 in theory (ideal cubes), with perfect cubes sitting on the lower envelope and primes on the upper.